atmospy: air quality data visualization#
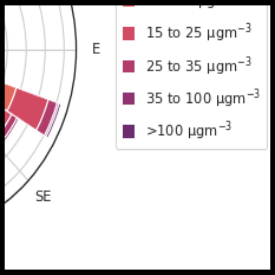
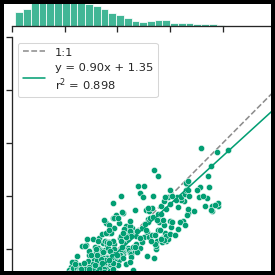
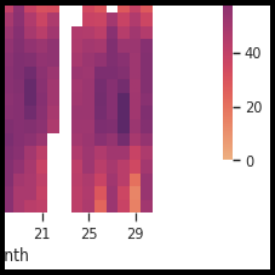
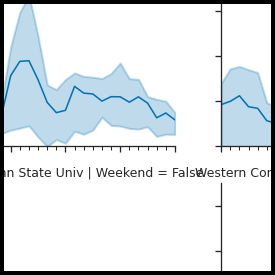
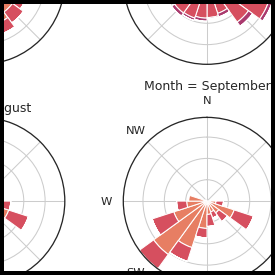
atmospy is a general-purpose data visualization library for air quality and air sensor data. It is based on matplotlib and heavily influenced by and dependent on seaborn. It is moderately opionated and the core objective is to provide a way to produce professional graphics for air quality data with a single function call.
For a more in-depth overview, you can read through the tutorial and introductory notes. To get started, visit the installation page or visit the example gallery to get inspired and see what is easily possible with atmospy.
atmospy is open-sourced and is not specific to any sensor or sensor company. Any and all can (and should) use it. To view the source code or report a bug, please visit the GitHub repository.
Note
This library was recently revamped and released and may contain bugs. Expect frequent updates throughout 2024.
If you have example datasets that you are interested in donating to be incorporated for general use, please open a GitHub issue and we will be in touch!
