Diel Ozone Trends#
atmospy components used: set_theme(), load_dataset(), dielplot()
import atmospy
import pandas as pd
atmospy.set_theme()
# Load the example dataset
df = atmospy.load_dataset("us-ozone")
# Select a single location
single_site_ozone = df[
df["Local Site Name"] == df["Local Site Name"].unique()[0]
]
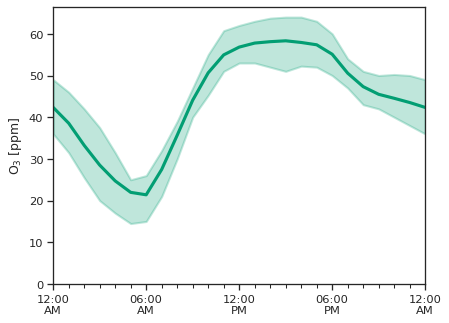
# Plot the diel trend
atmospy.dielplot(
single_site_ozone,
y="Sample Measurement", x="Timestamp Local",
ylabel="$O_3 \; [ppm]$",
plot_kws={"c": "g"},
ylim=(0, None)
)