Diel Trends by Weekend vs Weekday#
atmospy components used: set_theme(), load_dataset()
import atmospy
import seaborn as sns
atmospy.set_theme()
# load the data
bc = atmospy.load_dataset("us-bc")
# select just one random location for now
bc_multi_site = bc[bc["Local Site Name"].isin(bc["Local Site Name"].unique()[0:2])]
# create a column that sets a bool if the date is a weekend
bc_multi_site.loc[:, "Is Weekend"] = bc_multi_site["Timestamp Local"].dt.day_name().isin(["Saturday", "Sunday"])
# convert to long-form for faceting
bc_long_form = bc_multi_site.melt(
id_vars=["Timestamp Local", "Is Weekend", "Local Site Name"],
value_vars=["Sample Measurement"]
)
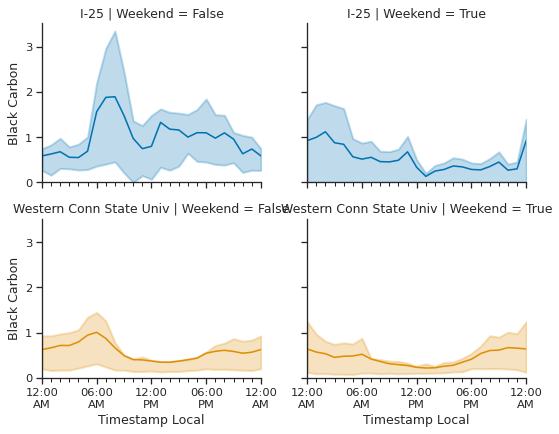
g = sns.FacetGrid(
bc_long_form,
row="Local Site Name",
col="Is Weekend",
hue="Local Site Name",
aspect=1.25,
)
g.map_dataframe(atmospy.dielplot, x="Timestamp Local", y="value")
# update the y-axis limit to force to zero
g.set(ylim=(0, None), ylabel='Black Carbon')
# update the titles to take up less space
g.set_titles("{row_name} | Weekend = {col_name}")