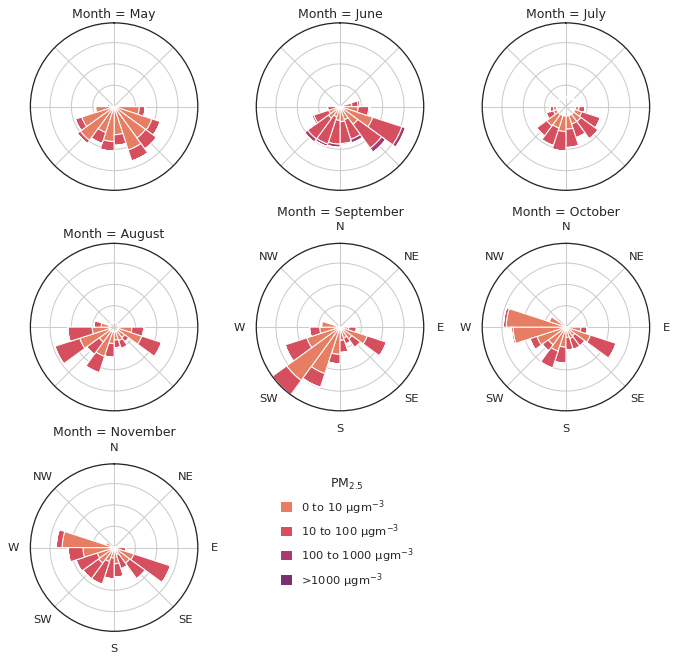
PM2.5 Pollution Rose by Month#

atmospy components used: set_theme(), load_dataset()
import atmospy
import seaborn as sns
atmospy.set_theme()

# Load the example dataset
met = atmospy.load_dataset("air-sensors-met")

# add a column that extracts the month from the timestamp_local column
met.loc[:, "Month"] = met["timestamp_local"].dt.month_name()

# conver to long form data
met_long_form = met.melt(id_vars=["timestamp_local", "Month", "ws", "wd"], value_vars=["pm25"])

# set up the FacetGrid
g = sns.FacetGrid(
    data=met_long_form,
    col="Month",
    col_wrap=3,
    subplot_kws={"projection": "polar"},
    despine=False
)

# map the dataframe using the pollutionroseplot function
g.map_dataframe(
    atmospy.pollutionroseplot,
    ws="ws", wd="wd", pollutant="value",
    faceted=True,
    segments=20,
    suffix="$µgm^{-3}$"
)

# add the legend and place it where it looks nice
g.add_legend(
    title="$PM_{2.5}$",
    bbox_to_anchor=(.535, 0.2),
    handlelength=1,
    handleheight=1
)