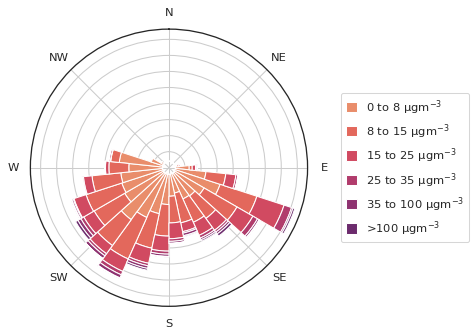
PM2.5 by Direction#

atmospy components used: set_theme(), load_dataset(), pollutionroseplot()
import atmospy
atmospy.set_theme()

# Load the example dataset
df = atmospy.load_dataset("air-sensors-met")

# Plot a pollution rose example for PM2.5
atmospy.pollutionroseplot(
    data=df, wd="wd", ws="ws", pollutant="pm25",
    suffix="$µgm^{-3}$", segments=30, calm=0.1,
    bins=[0, 8, 15, 25, 35, 100]
)