opcsim.plots.histplot
-
opcsim.plots.histplot(data, bins, ax=None, plot_kws={}, fig_kws={}, \*\*kwargs)¶ Plot the particle size distribution as a histogram/bar chart.
- Parameters
- dataarray of floats
An array containing the y variable you are plotting (ex. dNdlogDp)
- bins3xn array
A 3xn array containing the bin values for an OPC
- axmatplotlib axis
If an axis is provided, the histogram will be plotted on this axis. Otherwise, a new axis object will be created.
- plot_kwsdict
Optional keyword arguments to include. They are sent as an argument to the matplotlib bar plot.
- fig_kwsdict
Optional keyword arguments to include for the figure.
- Returns
- axmatplotlib axis object
Examples
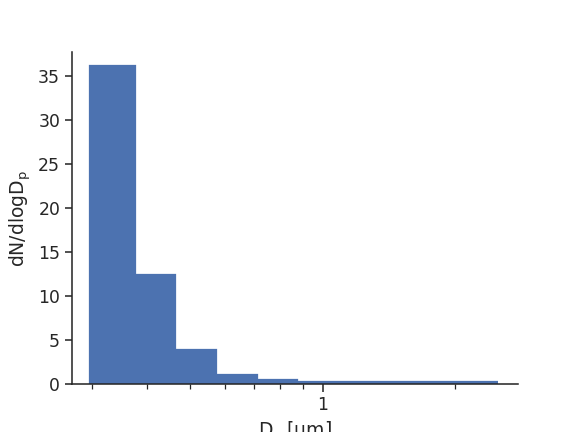
Plot a 10-bin OPC’s response to the Urban Distribution
>>> import opcsim, seaborn as sns
>>> opc = opcsim.OPC(wl=0.658, n_bins=10, dmin=0.3)
>>> opc.calibrate("psl")
>>> d = opcsim.load_distribution("Urban")
>>> ax = opcsim.plots.histplot(opc.evaluate(d), opc.bins)
>>> ax.set_ylabel("$dN/dlogD_p$")
>>> sns.despine()
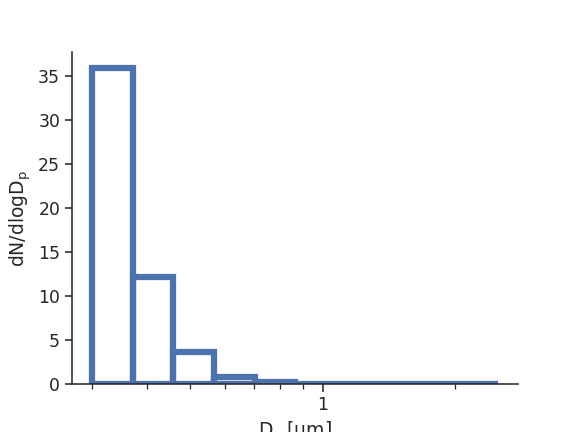
We can also plot the same OPC in volume (mass) space
>>> ax = opcsim.plots.histplot(
...         opc.evaluate(d, weight='volume'), opc.bins)
>>> ax.set_ylabel("$dV/dlogD_p$")
>>> sns.despine()
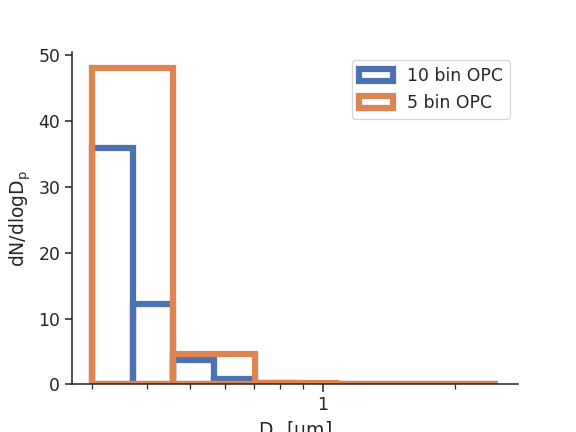
How about overlaying two OPC’s
>>> opcb = opcsim.OPC(wl=0.658, n_bins=5, dmin=0.3)
>>> opcb.calibrate("psl")
>>> ax = opcsim.plots.histplot(opc.evaluate(d),
...             opc.bins, label="10 bin OPC")
>>> ax = opcsim.plots.histplot(opcb.evaluate(d), opcb.bins,
...             label="5 bin OPC", ax=ax)
>>> ax.set_ylabel("$dN/dlogD_p$")
>>> ax.legend(loc='best')
>>> sns.despine()
What if we want to fill in the boxes?
>>> plot_kws = dict(fill=True)
>>> ax = opcsim.plots.histplot(opc.evaluate(d),
...             opc.bins, plot_kws=plot_kws)
>>> ax.set_ylabel("$dN/dlogD_p$")
>>> sns.despine()