opcsim.plots.cdfplot
-
opcsim.plots.cdfplot(distribution, ax=None, weight='number', plot_kws={}, fig_kws={}, \*\*kwargs)¶ Plot the CDF of a particle size distribution.
- Parameters
- distributionvalid AerosolDistribution
An aerosol distribution with the method pdf that can be evaluated at an array of particle diameters.
- weight{‘number’ | ‘surface’ | ‘volume’ | ‘mass’}
Choose how to weight the pdf. Default is number.
- axmatplotlib axis
If an axis is provided, the histogram will be plotted on this axis. Otherwise, a new axis object will be created.
- plot_kwsdict
Optional keyword arguments to include. They are sent as an argument to the matplotlib bar plot.
- fig_kwsdict
Optional keyword arguments to include for the figure.
- Returns
- axmatplotlib axis object
Examples
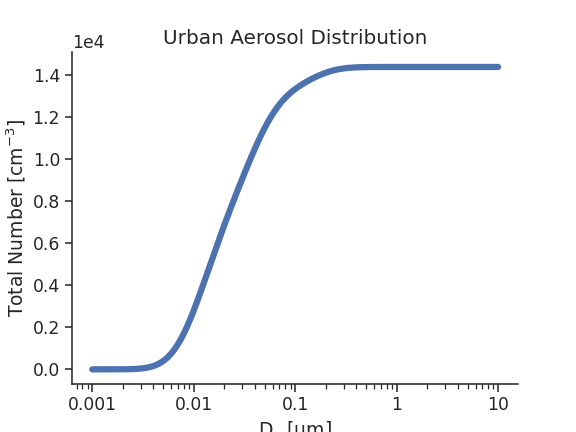
Plot the number-weighted Urban aerosol distribution
>>> import opcsim, seaborn as sns
>>> d = opcsim.load_distribution("Urban")
>>> ax = opcsim.plots.cdfplot(d)
>>> ax.set_title("Urban Aerosol Distribution", fontsize=16)
>>> sns.despine()
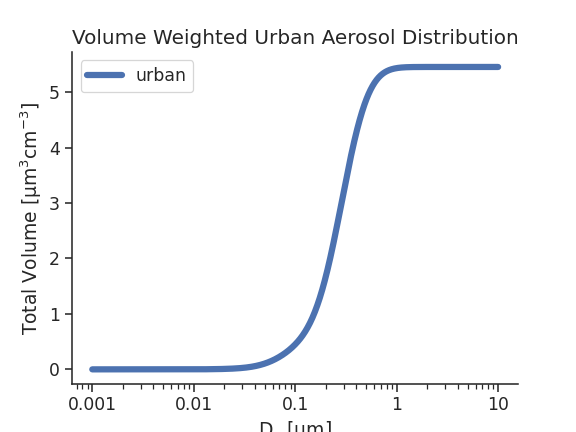
Let’s plot the volume weighted version
>>> ax = opcsim.plots.cdfplot(d, weight='volume')
>>> ax.set_title("Volume Weighted Urban Aerosol Distribution", fontsize=16)
>>> ax.legend(loc='best')
>>> sns.despine()