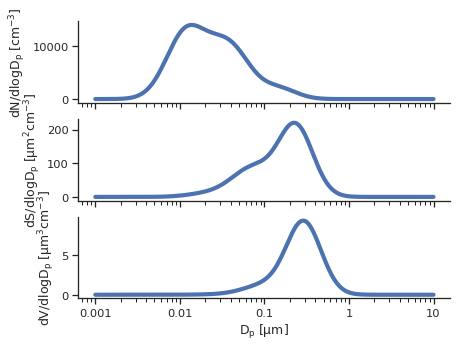
Plot the Urban Distribution in N, SA, and V

Python source code: [download source: three_weights.py]
import seaborn as sns
import opcsim
sns.set(style='ticks')

# Load the example urban distribution
d = opcsim.load_distribution("Urban")

# Set up a subplot with three subplots
fig, ax = plt.subplots(3, sharex=True)

# Plot the number-weighted pdf
opcsim.plots.pdfplot(d, ax=ax[0])

# Plot the SA-weighted pdf
opcsim.plots.pdfplot(d, weight='surface', ax=ax[1])

# Plot the volume-weighted pdf
opcsim.plots.pdfplot(d, weight='volume', ax=ax[2])

# Remove the xaxis labels
ax[0].set_xlabel("")
ax[1].set_xlabel("")

# Remove the top and right spines
sns.despine()