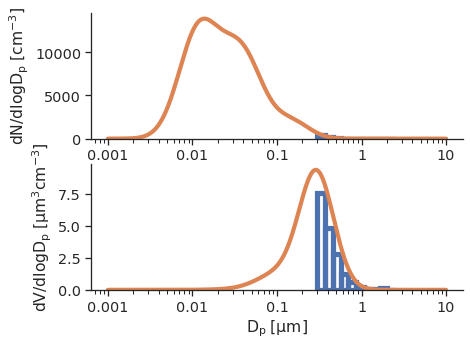
10-Bin OPC Response in Number and Volume Space

Python source code: [download source: opc_with_dist_number_and_vol.py]
import seaborn as sns
import matplotlib.pyplot as plt
import opcsim
sns.set(style='ticks', font_scale=1.25)

# Load the example urban distribution
d = opcsim.load_distribution("Urban")

# Build a 10-bin OPC
opc = opcsim.OPC(wl=0.658, n_bins=10, dmin=0.3)

# calibrate the OPC
opc.calibrate("psl")

# Set up the subplots
fig, (ax1, ax2) = plt.subplots(2)

# # Plot the histogram response
ax1 = opcsim.plots.histplot(opc.histogram(d), bins=opc.bins, ax=ax1)

# Overlay the distribution
ax1 = opcsim.plots.pdfplot(d, ax=ax1)

# # Repeat the above step but weight by volume
ax2 = opcsim.plots.histplot(opc.histogram(d, weight='volume'), bins=opc.bins, ax=ax2)

# Overlay the distribution
ax2 = opcsim.plots.pdfplot(d, weight='volume', ax=ax2)

# Remove axis labels
ax1.set_xlabel("")

# Remove the top and right spines
sns.despine()