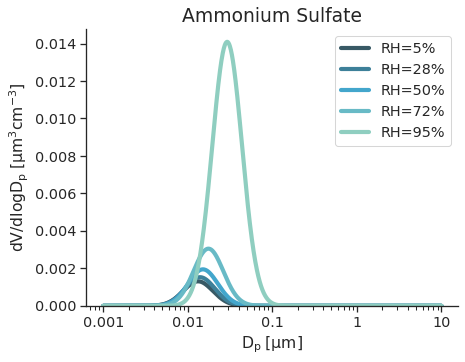
Visualize the Impact of Hygroscopic Growth

Python source code: [download source: hygroscopic_growth_pdf.py]
import seaborn as sns
import numpy as np
import opcsim
sns.set(style='ticks', font_scale=1.25)

# build a distribution for a single mode of ammonium sulfate
d = opcsim.AerosolDistribution("Ammonium Sulfate")

# add a single mode
d.add_mode(1e3, 0.8e-2, 1.5, refr=(1.521+0j), rho=1.77, kappa=0.53)

# iterate over a few RH's and plot
ax = None
cpal = sns.color_palette("GnBu_d", 5)

for i, rh in enumerate(np.linspace(5, 95, 5)):
    ax = opcsim.plots.pdfplot(d, rh=rh, plot_kws=dict(color=cpal[i]),
                              ax=ax, weight='volume', label="RH={:.0f}%".format(rh))

# Set the title and axes labels
ax.set_title("Ammonium Sulfate", fontsize=18)

# Add a legend
ax.legend(loc='best')

# Set the ylim
ax.set_ylim(0, None)

# Remove the top and right spines
sns.despine()