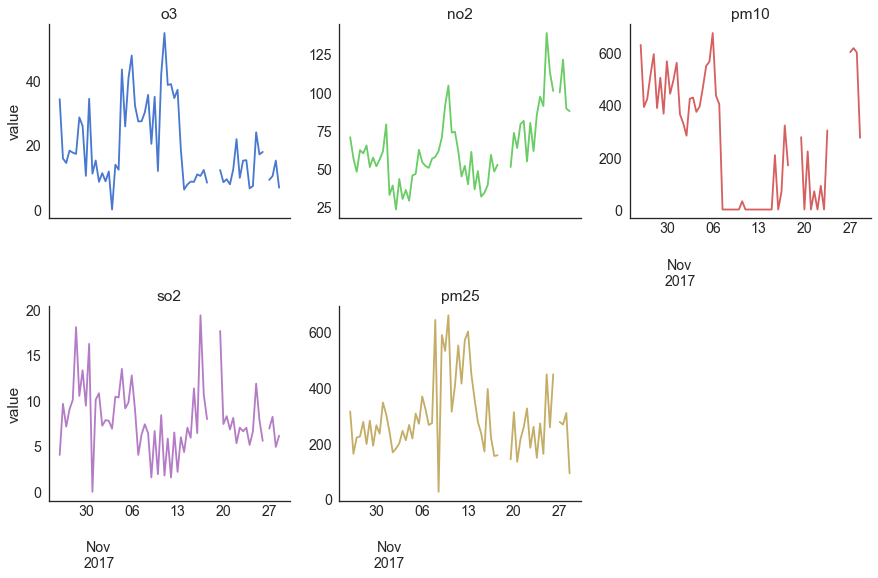
Compare All Pollutants at Anand Vihar in Delhi
Python source code: [download source: pollution_outlook_delhi.py]
import matplotlib.pyplot as plt
import seaborn as sns
import openaq

sns.set(style="white", palette='muted', font_scale=1.35, color_codes=True)

api = openaq.OpenAQ()

# grab the data
df = api.measurements(city='Delhi', location='Anand Vihar', limit=10000, df=True)

# clean up the data by removing values below 0
df = df.query("value >= 0.0")

# Map the gas species from ugm3 to ppb (gas-phase species only)
df['corrected'] = df.apply(lambda x: openaq.utils.mass_to_mix(x['value'], x['parameter'], unit='ppb'), axis=1)

# Build a custom plot function to make nice datetime plots
def dateplot(y, **kwargs):
    ax = plt.gca()

    data = kwargs.pop("data")
    rs = kwargs.pop("rs", '12h')

    data.resample(rs).mean().plot(y=y, ax=ax, grid=False, **kwargs)

# Set up a FacetGrid
g = sns.FacetGrid(df, col='parameter', col_wrap=3, size=4, hue='parameter', sharey=False)

# Map the dataframe to the grid
g.map_dataframe(dateplot, "corrected", rs='12h')

# Set the titles
g.set_titles("{col_name}", fontsize=16)

# Set the axis labels
g.set_axis_labels("", "value")