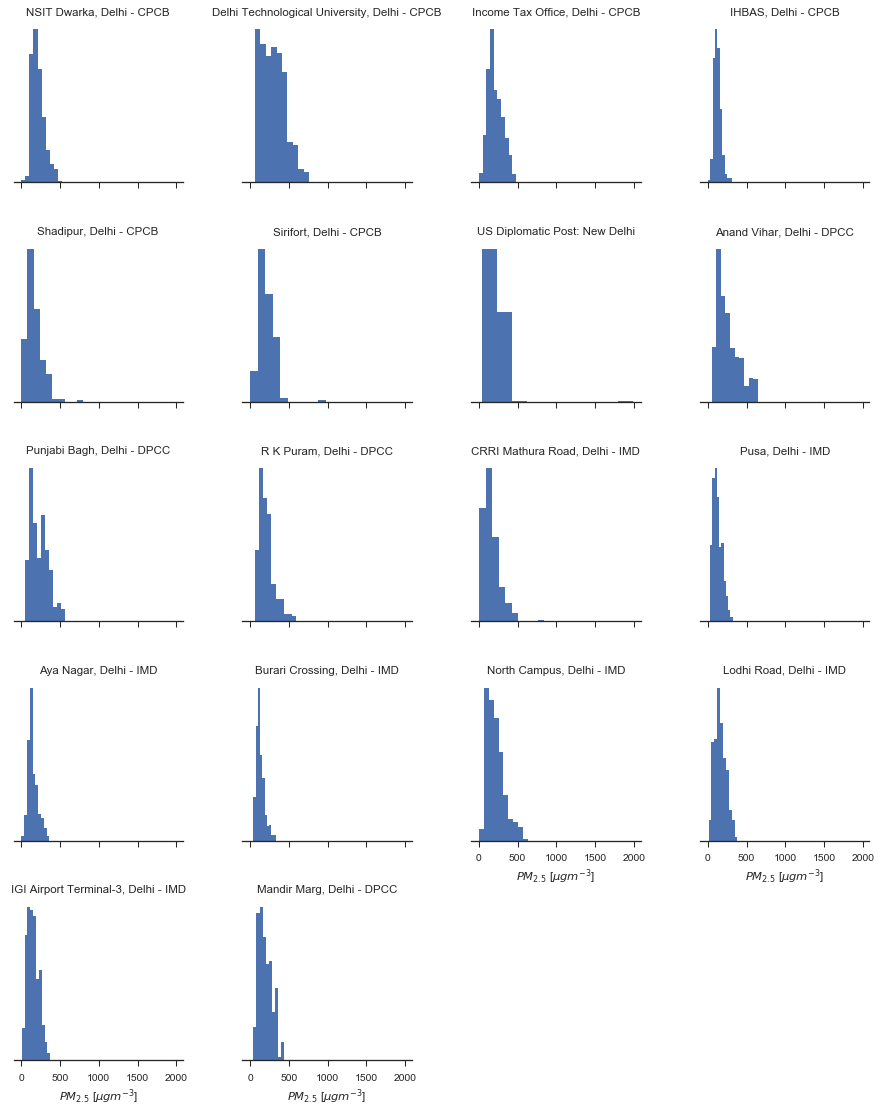
Distribution of PM2.5 at Various Sites across Delhi
Python source code: [download source: pm25_histogram_delhi.py]
import matplotlib.pyplot as plt
import seaborn as sns
import openaq

sns.set(style="ticks", font_scale=1.)

api = openaq.OpenAQ()

# grab the data
res = api.measurements(city='Delhi', parameter='pm25', limit=10000, df=True)

# Clean up the data by removing values below 0
res = res.query("value >= 0.0")

# Setup a FacetGrid
g = sns.FacetGrid(data=res, col='location', col_wrap=4, size=3, sharex=True,
                    sharey=False)

# Map a histogram for each location
g.map(plt.hist, "value")

# Set the titles
g.set_titles("{col_name}")

# Set the axis labels
g.set_axis_labels("$PM_{2.5}$ [$\mu g m^{-3}$]", None)

# Remove the left axis
sns.despine(left=True)

# Remove the yticks
g.set(yticks=[])